
Multi-Residue Analysis of 90 Emerging Contaminants In Liquid And Solid Environmental Matrices By Ultra-High-Performance Liquid Chromatography Tandem Mass Spectrometry
Abstract
Reported herein is new analytical methodology for the determination of 90 emerging contaminants (ECs) in liquid environmental matrices (crude wastewater, final effluent and river water). The application of a novel buffer, ammonium fluoride improved signal response for several ECs determined in negative ionisation mode. Most notably the sensitivity of steroid estrogens was improved by 4–5 times in environmental extracts. Method recoveries ranged from 40 to 152% in all matrices and method quantitation limits (MQLs) achieved were <1 ng L−1 for numerous ECs. Development of a microwave assisted extraction (MAE) protocol as an additional sample extraction step for solid matrices enabled 63 ECs to be simultaneously analysed in digested sludge. To the authors knowledge this is considerably more than any previously reported MAE method. Here, MQLs ranged from 0.1–24.1 ng g−1 dry weight. The application of MAE offers several advantages over pressurized liquid extraction including faster sample preparation, lower solvent requirements, and the ability to perform several extractions simultaneously as well as lower purchasing and running costs. To demonstrate the method’s sensitivity, application to environmental samples revealed 68 and 40 ECs to be above their respective MQL in liquid environmental samples and digested sludge, respectively. To date, this is the most comprehensive multi-residue analytical method reported in the literature for the determination of ECs in both liquid and solid environmental matrices.
Introduction
Municipal derived ECs (personal care products, pharmaceuticals and illicit drugs) are widely known to be present in wastewaters, surface waters and amended agricultural soils [1]. Due to their pharmacological properties, they pose a potential threat to the ecology of the receiving environment. However, at present ECs are not regulated by environmental legislation. Current EU legislation is expected to be broadened to include ECs as in 2012 diclofenac, 17β-estradiol (E2) and 17α-ethinylestradiol (EE2) were proposed as priority hazardous substances [2]. Proposed legislative targets for consent were 100, 0.4 and 0.035 ng L−1, respectively [2]. These very low limits underline the threat posed by this family of environmental pollutants. For example, proposed legislative targets for the steroid estrogens are below 1 ng L−1 as they are endocrine disrupting chemicals which can exert adverse health effects on the sexual characteristics of fish [1]. Furthermore, several antibiotics (erythromycin, clarithromycin, azithromycin) have been recommended for inclusion in the first watch list under the Environmental Quality Standards Directive (2008/105/EC) [3]. Determining environmental risk and developing accurate legislation relies on robust monitoring data-sets for ECs. These are currently lacking and rely on the application of validated analytical methodologies. Analytical methods report the use of gas chromatography-mass spectrometry [4] and more popularly liquid chromatography-mass spectrometry (LC–MS) [4], [5], [6], [7] and [8] due to more straight forward sample preparation requirements for polar chemicals (i.e., no derivatization needed).
The preparation of liquid environmental samples for LC–MS analysis typically involves filtration to remove particulates and off-line [6] and [7] or on-line [5] and [8] solid phase extraction (SPE). This pre-concentration step is used to ensure adequate sensitivity for MS detection [9]. On the other hand, large volume direct injection can be applied to avoid the use of SPE [10]. This can be suitable where the MS detector is sufficiently sensitive to monitor ECs at background concentrations (i.e., ng L−1). For analysis, ultra-performance liquid chromatography (UPLC) is preferred over conventional LC as the separation method. UPLC provides a more efficient stationary phase through the reduction in particle size. This results in higher sensitivity, reduced run times and lower solvent consumption [4]. In terms of mechanism of separation, reversed phase chromatography is most popular as it can successfully separate a broad range of ECs [4] and [6]. However, for very polar ECs such as metformin hydrophilic interaction liquid chromatography (HILIC) may be needed [11]. This approach will require a different sample diluent and therefore additional samples need to be prepared. For detection, tandem mass spectrometry (MS/MS) and more specifically triple quadrupoles are chosen for quantitative environmental analysis due to their high sensitivity and selectivity[4].
In the literature, there is a lack of multi-residue methods for the determination of ECs in solid matrices. Extraction techniques report the use of ultra-sonic solvent extraction[12] and [13], MAE [13], [14], [15], [16] and [17] and pressurized liquid extraction (PLE)[13], [18], [19] and [20]. A comparison of these methods for the extraction of quinolone antibiotics from sewage sludge revealed no significant difference in extraction efficiency between the three techniques [13]. However, MAE offers several advantages over PLE such as lower solvent consumptions, shorter extraction times and the ability to extract several samples simultaneously [16]. MAE relies on microwave energy to heat the sample/solvent mixture for extraction of ECs [21]. Methods in the literature have reported the successful extraction of quinolone antibiotics [13], benzophenone derived compounds [16], endocrine disruptors (bisphenol A–BPA, E2, EE2, estriol, nonylphenol, octylphenol and their corresponding ethoxylates) [15], triclosan [14] and some pharmaceuticals and illicit drugs [17]. Following extraction, extracts are typically diluted in water to <5% organic content and treated as a liquid sample (i.e., subject to SPE and analysed by LC–MS/MS).
To date, there have been several shortcomings of previously reported methods for the determination of ECs in environmental matrices. These include requiring more than one SPE cartridge for extraction and/or requiring more than one sample diluent (e.g., for metformin) to encompass a broad range of ECs [22], [23] and [24], monitoring for a limited number of ECs (i.e., <25 and in some cases without metabolites) [5], [24],[25] and [26], validated and applied in less complex environmental matrices only (e.g., final effluent and river water) [5], [8] and [25] and failure to include analysis of solid matrices [5], [7], [8], [25] and [26]. To address these shortcomings, the objectives of this work were to develop a multi-residue analytical methodology which was:
(i)
Suitable for the determination of a variety of ECs and their metabolites exhibiting a range of chemistries and therefore expectant fate behaviours in environmental matrices.
(ii)
Straight forward in its application by utilising a single SPE cartridge per analysis (i.e., only one sample diluent required).
(iii)
Robust in its application across a variety of environmental matrices of differing complexity (wastewater, river water and sludge).
(iv)
Applicable for the analysis of ECs in both liquid and solid environmental matrices.
This was achieved by developing off-line SPE (liquid samples) and MAE (solid samples) sample preparation techniques and UPLC-MS/MS methodology. A total of 90 ECs were included in the method from a broad range of chemical classes (UV filters, parabens, plasticizers, steroid estrogens, antibacterials/antibiotics, hypertension drugs, non-steroidal anti-inflammatory drugs (NSAIDs), lipid regulators, anti-histamines, drugs for diabetes, cough suppressants, beta-blockers, H2 receptor agonists, drug precursors, anti-cancer drugs, anaesthetics, anti-depressants, anti-epileptics, calcium channel blockers, hypnotics, anti-psychotics, veterinary, human indicators, analgesics, stimulants, opioids and metabolites).
Materials and Methods
Materials
A total of 90 ECs (personal care products, pharmaceuticals and illicit drugs) were selected for method development. Selection was based upon reference to existing and proposed EU legislation, UK prescription data, metabolism and excretion from the human body, known environmental occurrence, persistence during wastewater treatment and toxicity to aquatic organisms. Chemical names and properties of selected ECs are detailed in Table S1.
The internal standards acetaminophen-D4, ibuprofen-D3, bisphenol A-D16, carbamazepine-13C6, ketoprofen-D3, naproxen-D3, sertraline-D3, tamoxifen 13C2 15N, propranolol-D7, atenolol-D5 and metformin (dimethyl-D6) were purchased from Sigma–Aldrich (Gillingham, UK). Bezafibrate-D6 was obtained from QMX laboratories (Thaxted, UK). Methylparaben-13C, amphetamine-D5, methamphetamine-D5, MDMA-D5, MDA-D5, heroin-D9, codeine-D6, ketamine-D4, cocaine-D3, benzoylecgonine-D8, EDDP-D3, morphine-D3, cotinine-D3, cocaethylene-D8, temazepam-D5, 1S,2R-(+) ephedrine-D3, mephedrone-D3, methadone-D9, norketamine-D4, estrone (2,4,16,16-D4), estradiol (2,4,16,16-D4) and quetiapine-D8 hemifumurate were purchased from LGC standards (Middlesex, UK). Citalopram-D6, metoprolol-D7, fluoxetine-D5 and mirtazapine-D3 were obtained from TRC (Toronto, Canada). All standards were purchased as 0.1 or 1.0 mg mL−1 solutions or in powder form. Those chemicals in powder form were prepared at a concentration of 1 mg mL−1 in the recommended solvent and stored in the dark at –20 °C. Stock solutions of antibiotics were prepared monthly.
Methanol (MeOH) and toluene was HPLC grade and purchased from Sigma–Aldrich. Water (H2O) was of 18.2 MΩ quality (Elga, Marlow, UK). All glassware was deactivated using 5% dimethylchlorosilane (DMDCS) in toluene (Sigma–Aldrich) to mitigate the loss of basic chemicals onto −OH sites present on glass surfaces. This consisted of rinsing once with DMDCS, twice with toluene and three times with MeOH. A range of mobile phase buffers were tested during method development including ammonium acetate (NH4OAc), ammonium formate, ammonium hydroxide (NH4OH, 30%) and ammonium fluoride (NH4F) obtained from either Sigma-Aldrich or Fisher Scientific (Loughborough, UK). Formic acid (>95%, HCOOH) and acetic acid (1.0 M, CH3COOH) were purchased from Sigma–Aldrich. Oasis HLB, MCX and MAX (60 mg, 3 mL) SPE cartridges were purchased from Waters (Manchester, UK).
To validate the method corresponding grab samples (i.e., accounting for hydraulic retention time-HRT) of crude wastewater and final effluent were collected from a trickling filter wastewater treatment works (WwTW, population equivalent ∼105,000) in South–West England. River water from a medium sized river was also collected upstream of the WwTW discharge point. Samples were transported to the laboratory on ice and within 15 min of collection. Digested sludge was collected from an anaerobic digestion plant in the South-West of England which treats on average, 1800 m3 of waste activated sludge/primary sludge per day. The process consists of 6 acid-phase digesters in series and 8 mesophilic digesters in parallel.
Extraction procedure for liquid samples
Initially, samples were filtered through GF/F filters (0.7 μm) and adjusted to pH 7.5 ± 0.1. Crude wastewater and final effluent (50 mL) and river water (100 mL) were spiked with 50 ng of all internal standards and loaded onto Oasis HLB cartridges. These were conditioned using 2 mL MeOH followed by 2 mL H2O at a constant flow rate of 1 mL min−1. Samples were loaded at 5 mL min−1 then dried under vacuum. Elution was performed using 4 mL MeOH at a flow rate of 1 mL min−1. Extracts were then dried under nitrogen using a TurboVap evaporator (Caliper, UK, 40 °C, N2, <5 psi). This was then reconstituted in 500 μL 80:20 H2O:MeOH and transferred to polypropylene vials (Waters, Manchester, UK). For samples analysed by direction injection (i.e., no SPE), 400 μL of the filtered sample was transferred to a vial and spiked with 50 ng of internal standards. The volume was then adjusted to 500 μL with MeOH to match mobile phase starting conditions. A schematic of the extraction procedure is shown in Fig. 1 .
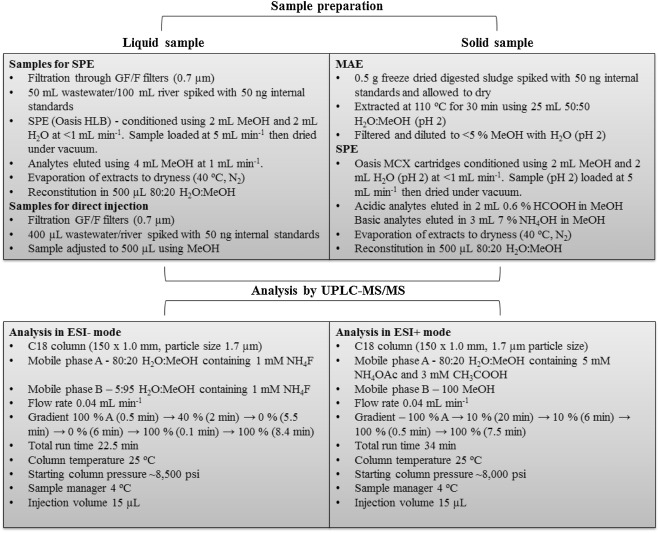
Fig. 1. – Overview of analytical protocol used to determine target ECs in crude wastewater, final effluent, river water and digested sludge.
Extraction of solid matrices by microwave assisted extraction
Digested sludge for extraction was frozen and freeze dried (ScanVac, CoolSafe freeze dryer, Lynge, Denmark). 0.5 g was spiked with 50 ng of all internal standards and left for a minimum of 1 h. Extraction was performed using 25 mL of 50:50 MeOH:H2O (pH 2) using a 800 W MARS 6 microwave (CEM, UK). Samples were heated to 110 °C over 10 min and then maintained at this temperature for 30 min. Samples were then filtered (0.7 μm) and adjusted to <5% MeOH using H2O (pH 2). Solid phase extraction was then performed using Oasis MCX cartridges conditioned with 2 mL MeOH followed by 2 mL H2O (pH 2) at 1 mL min−1. Samples were then loaded at 5 mL min−1 and dried. Analytes were then eluted in separate fractions. Acidic analytes were eluted using 2 mL 0.6% HCOOH in MeOH (fraction 1) and basic analytes in 3 mL 7% NH4OH in MeOH (fraction 2). Dried extracts were then reconstituted separately in 500 μL in 80:20 H2O:MeOH and filtered through pre-LCMS 0.2 μm PTFE filters (Whatman, Puradisc) (Fig. 1). During the development process Oasis HLB, MCX and MAX cartridges were trialled. Extraction temperatures of 90, 110 and 130 °C and solvent compositions of 90:10, 50:50 and 10:90 H2O:MeOH at pH 2 were also tested.
Liquid chromatography-mass spectrometry
Chromatography was performed using a Waters Acquity UPLC system (Waters, Manchester, UK). To maximise sensitivity and achieve good chromatography for these ECs exhibiting a broad range of chemistries, two chromatography methods were developed.
For acidic compounds, separation was achieved using 80:20 H2O:MeOH containing 1 mM NH4F (mobile phase A) and 5:95 H2O:MeOH also containing 1 mM NH4F (mobile phase B). Starting conditions were 100% A which was maintained for 0.5 min. This was then reduced to 40% A over 2 min and to 0% A over 5.5 min. These conditions were maintained for 6 min then returned to starting conditions. Starting conditions were held for 8.4 min to allow re-equilibration. The total run time was 22.5 min. Basic compounds were separated using 5 mM NH4OAc in 80:20 H2O:MeOH containing 0.3% CH3COOH (mobile phase A) and MeOH (mobile phase B). Starting conditions were 100% A which were reduced to 10% over 20 min. This was maintained for 6 min before returning to starting conditions. Starting conditions were held for 7.5 min to allow for re-equilibration. The total run time was 34 min.
Both methods used a reversed-phase BEH C18 column (150 × 1.0 mm, 1.7 μm particle size) (Waters, Manchester, UK) with a 0.2 μm, 2.1 mm in-line column filter maintained at 25 °C. The mobile phase flow rate was 0.04 mL min−1 and an injection volume of 15 μL was used in both methods. The UPLC was coupled to a Xevo TQD Triple Quadrupole Mass Spectrometer (Waters, Manchester, UK), equipped with an electrospray ionisation source. The determination of acidic compounds was performed in negative ionisation mode with a capillary voltage of 3.20 kV. Basic compounds were determined in positive mode with a capillary voltage of 3.00 kV. For both methods, the source temperature was 150 °C and the desolvation temperature was 400 °C. The cone gas flow was 100 L h−1 and the desolvation gas flow was 550 L h−1. Nitrogen was used as the nebulising and desolvation gas, and argon as the collision gas.
Method performance
Linearity was established by triplicate injection of a 17 point calibration curve ranging in concentration from 0.01–1000 ng mL−1. Inter-day and intra-day precision and accuracy was determined by triplicate injections of 10, 100 and 500 ng mL−1 within a 24 h period and across three separate days, respectively. Instrumental detection limits (IDLs) and instrument quantitation limits (IQLs) were calculated according to the lowest concentration which gave a signal to noise ratio of ≥3 and ≥10 respectively. Recovery of target chemicals was determined by spiking crude wastewater and final effluent at a concentration of 100 and 1000 ng L−1. For river water, concentrations of 50 and 500 ng L−1 were selected. For those chemicals determined by direct injection, concentrations of 10 and 100 μg L−1 were used. In digested sludge, recovery of analytes was assessed at spike concentrations of 50 and 100 ng g−1.
Results and Discussion
Liquid chromatography-tandem mass spectrometry
In order to optimise chromatographic and mass spectrometry performance for acidic and basic compounds, analysis was separated into two different chromatographic methods (Fig. 2). Both methods utilised a reversed-phase BEH C18 column (150 × 1.0 mm, 1.7 μm particle size) maintained at 25 °C with an injection volume of 15 μL. This column has a smaller than typical particle size and internal diameter which results in low mobile phase consumptions and very good sensitivity [6] and [18]. To avoid further sample preparation requirements it was ensured that the same reconstitution diluent (80:20 H2O:MeOH) could be used for both methods. For the determination of acidic compounds including NSAIDs, steroid estrogens, parabens, some benzophenones and other personal care products a number of mobile phase additives were tested (see Section 2.1.). A novel buffer, NH4F was found to provide excellent chromatographic separations and peak shapes whilst offering improved signal intensity by up to 5 times in environmental extracts (Fig. 3). A previous study found signal intensities of indomethacin, butylparaben, 11-nor-9-carboxy-Δ9-tetrahydrocannabinol, propylparaben, tetrahydrocannabinol and triclocarban were all improved by ≥5 times when using NH4F over ammonium formate [27]. Increased deprotonation here may be a result of the strong basicity of the fluoride anion in the gas phase [28]. It was selected for further method development as the improved signal response was most notable for the steroid estrogens estrone (E1), E2 and EE2. This is significant as these compounds are often found in environmental waters at concentrations <10 ng L−1[1]. Furthermore, this enhanced response could be exploited by dedicated methods aimed at monitoring steroid estrogens (E2 and EE2) at their proposed legislative targets of 0.4 and 0.035 ng L−1, respectively. These limits are currently below the detection capabilities of recently reported methodologies which use a conventional mobile phase containing NH4OH[24] and [29].
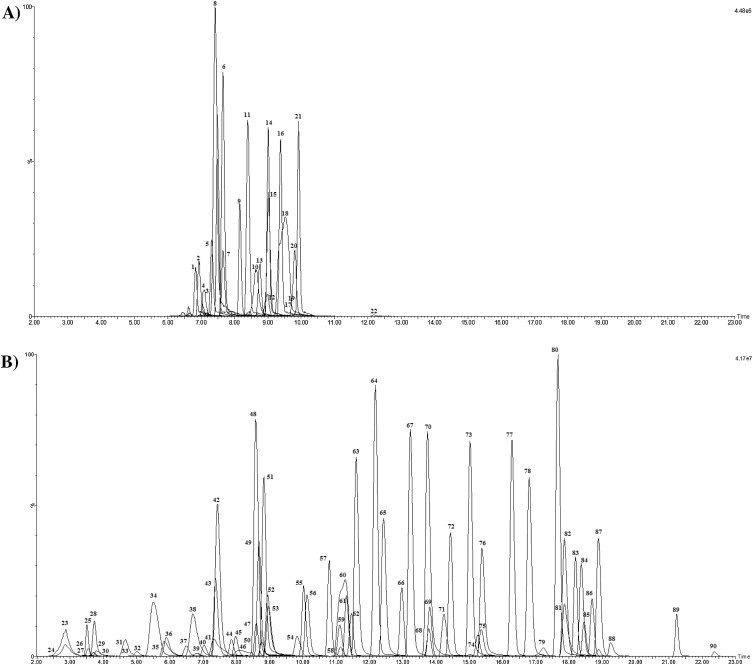
Fig. 2.
UPLC–MS/MS chromatograms (2–23 min) of ECs extracted from crude wastewater spiked at 1000 ng L−1and analysed under ESI - (A) and ESI+ (B) mobile phase conditions. Note: see Table 1 for chemical identities.
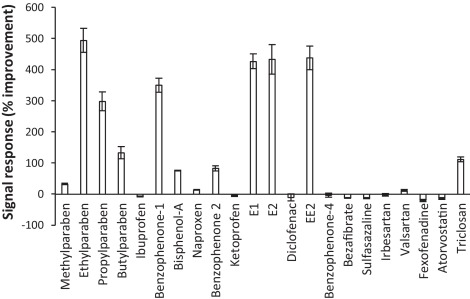
Fig. 3.
Improvement in signal response using NH4F over NH4OH for the determination of ECs in ESI-mode spiked at 1000 ng L−1 in crude wastewater and subject to SPE (ordered by retention time).
Basic compounds were separated using a MeOH:H2O gradient containing 5 mM NH4OAc and 3 mM CH3COOH (pH 4.7) and determined in electro-spray ionisation (ESI)+ mode. These conditions were vital for achieving good separation and peak shape, particularly for those very polar ECs such as metformin when using a C18 column. Although advantageous for improved response for compounds such as iopromide and methotrexate, any further reduction of pH resulted in a loss of any chromatographic retention and peak shape of the more polar ECs. Therefore, the development of multi-residue methods do result in trade-offs to give the best overall performance. The addition of NH4OAc was important to improve ESI performance (specifically for azithromycin), and to achieve reproducible retention times when analysing environmental extracts. A concentration of 5 mM was found to be the maximum concentration which did not negatively affect peak shape and separation of those early eluting compounds (metformin, creatinine etc). These conditions avoided the need for a separate method for very polar chemicals (e.g., HILIC [11]). This would have resulted in additional sample preparation as different sample diluents would be needed. A full gradient was applied which gave good separation of target ECs with retention times ranging from 2.7 (creatinine, log Kow 1.7) to 22.4 min (tamoxifen, log Kow 6.3) (Table S2, Fig. 2). Tramadol (Peak 60 Fig. 2) was a co-eluting peak (with desmethylvenlafaxine) and as a chromatographic resolution of 1.5 could not be achieved, quantitation for this compound is only considered semi-quantitative.
Optimised MS/MS parameters for 128 chemicals (90 compounds, 38 internal standards) are compiled in Table S2. Of the chemicals studied, 22 (plus 8 internal standards) were found to give a higher response in ESI- mode. In ESI+, the remaining 68 (plus 30 internal standards) chemicals were more sensitive. In all cases, [M H]− for ESI-and [M + H]+ for ESI + were selected as the molecular ion. Two MRM transitions were monitored for each compound (where possible) for quantification and confirmation purposes. For the labelled internal standards, one MRM transition was monitored as these will not be found in the environment. Also, due to poor fragmentation, only one transition could be monitored for ketoprofen, diclofenac, ibuprofen, 1,7 dimethylxanthine and norfluoxetine. As these ECs could not satisfy EU guidelines (i.e., two MRM transitions) [30], their analysis can only be considered semi-quantitative. Other quality criteria used to ensure the quality of data included standard tolerances of ion ratio and chromatographic retention time [30]. Data acquisition was performed using time windows of ∼4 min. This ensured mass spectrometry performance (i.e., number of data points acquired across a peak) was not compromised when including a high number of chemicals into a single method. The minimum number of data points across a single peak was 12 where the greatest number of acquisitions were taking place.
Instrument performance
Instrument performance was determined by establishing linear response, intra- and inter-day precision and accuracy, and sensitivity (IDLs and IQLs). Mean correlation coefficients (r2) of the calibration curves were generally ≥0.997 for the concentration range studied (0–500 or 0–1,000 ng mL−1 dependant on the concentration of the stock solution purchased) (Table 1). However, triclosan, benzoylecgonine and mirtazapine did not exhibit acceptable linearity (i.e., r2 ≥ 0.997) over the entire concentration range tested. These chemicals were divided into two overlapping concentration ranges to achieve r2 of ≥0.997. To demonstrate, benzoylecgonine was linear over the concentration ranges 0.05–100 and 50–500 ng mL−1 with r2’s of 0.998 and 0.999, respectively (Table 1). For concentrations between 50 and 100 ng mL−1, the lower calibration range was applied. Both intra-and inter-day precision showed a deviation of <10% for the majority of chemicals studied. Accuracy was typically within the range 90–110% for most chemicals both within the same day and between different days. IQLs ranged from 30 ng L−1 for tamoxifen to ∼5,000 ng L−1 for ranitidine and iopromide (Table 1). Such a wide range of IDLs and IQLs is typical for multi-residue methods which include a large number of chemicals of varying chemical properties [7] and [8]. Nevertheless, these IDLs and IQLs are insufficient to monitor all chemicals at concentrations typically found in environmental matrices. To overcome this, SPE was proposed as a pre-concentration step to allow their quantitation at indigenous levels.
Instrumental performance data for target ECs in diluent (ordered by retention time).
Key: IDL, instrument detection limit; IQL, instrument quantitation limit.
a: Two different calibrations used as linear relationship was not established over the complete concentration range.
b:Instrument performance was determined at concentrations of 10, 100 and 500 ng mL.
| Chemical | No. | Linearity | Linearity | Inter-day instrument performanceb | Inter-day instrument performanceb | Inter-day instrument performanceb | Inter-day instrument performanceb | IDLS/N(ng mL-1) | IQLS/N(ng mL-1) |
|---|---|---|---|---|---|---|---|---|---|
| Range (ng mL-1) | r2 | Precision (%) | Accuracy (%) | Precision (%) | Accuracy (%) | ||||
| Chemicals determined in ESI - mode | |||||||||
| 4-Benzophenone | 1 | 1.01500 | 0.997 | 2.3 | 103 | 3.8 | 105.1 | 0.31 | 1.01 |
| Sulfasalazine | 2 | 0.901 | 0.999 | 3.9 | 105.2 | 2.4 | 104.7 | 0.27 | 0.9 |
| Methylparaben | 3 | 0.061 | 0.998 | 1.1 | 93.3 | 6 | 97.4 | 0.01 | 0.06 |
| Valsartan | 4 | 1.121 | 0.998 | 1.9 | 115.8 | 3.5 | 118.6 | 0.34 | 1.12 |
| 2-benzophenone | 5 | 0.05600 | 0.997 | 1.1 | 99.6 | 4.2 | 97.6 | 0.01 | 0.05 |
| Bezafibrate | 6 | 0.101 | 0.998 | 2.3 | 97.8 | 2.8 | 97.9 | 0.03 | 0.1 |
| Ketoprofen | 7 | 0.541 | 0.998 | 2.2 | 99.9 | 2.6 | 99.4 | 0.11 | 0.54 |
| Naproxen | 8 | 0.491 | 0.998 | 1.5 | 97.7 | 2.5 | 98.3 | 0.1 | 0.49 |
| Ethylparaben | 9 | 0.11600 | 0.997 | 2.6 | 112.3 | 2.1 | 113.1 | 0.03 | 0.11 |
| Fexofenadine | 10 | 0.091 | 0.998 | 2.1 | 106.3 | 6.5 | 104.6 | 0.03 | 0.09 |
| Irbesartan | 11 | 0.50600 | 0.998 | 2.6 | 96.9 | 4.1 | 98.3 | 0.1 | 0.5 |
| Diclofenac | 12 | 0.10600 | 0.997 | 7.9 | 89.6 | 4.5 | 91.8 | 0.03 | 0.1 |
| Bisphenol A | 13 | 0.10600 | 0.997 | 2.4 | 103.6 | 1.3 | 104.6 | 0.03 | 0.1 |
| Propylparaben | 14 | 0.12400 | 0.997 | 5.7 | 96.4 | 4.3 | 98.4 | 0.04 | 0.12 |
| Atorvastatin | 15 | 0.05500 | 0.997 | 2.6 | 98 | 3.5 | 100.9 | 0.01 | 0.05 |
| 1-Benzophenone | 16 | 0.06600 | 0.996 | 2.3 | 106.8 | 3.3 | 106.7 | 0.01 | 0.06 |
| EE2 | 17 | 0.481 | 0.997 | 2.6 | 94.6 | 3.3 | 93.2 | 0.1 | 0.48 |
| Ibuprofen | 18 | 0.051 | 0.998 | 2.4 | 93.7 | 2.3 | 94.2 | 0.01 | 0.05 |
| E2 | 19 | 0.471 | 0.997 | 3.1 | 96.6 | 2.6 | 96.3 | 0.09 | 0.47 |
| E1 | 20 | 0.491 | 0.998 | 1.8 | 96.9 | 2.1 | 98.6 | 0.1 | 0.49 |
| Butylparaben | 21 | 0.06600 | 0.997 | 5 | 97.1 | 3.6 | 100.3 | 0.01 | 0.06 |
| Triclosana | 22 | 1.132001001 | 0.9970.998 | 9.4 | 69.6 | 6.5 | 71.4 | 0.34 | 1.13 |
| Chemicals determined in ESI + mode | |||||||||
| Creatinine | 23 | 1.001 | 0.999 | 2.8 | 100.1 | 1.4 | 100.5 | 0.3 | 1 |
| Metformin | 24 | 0.431 | 0.998 | 1.3 | 97 | 1.5 | 96.3 | 0.09 | 0.43 |
| Dihydromorphine | 25 | 0.05500 | 0.997 | 2.7 | 108.5 | 4.4 | 106 | 0.01 | 0.05 |
| Nicotine | 26 | 1.00500 | 0.998 | 2.4 | 98.4 | 1.2 | 98.3 | 0.3 | 1 |
| Normorphine | 27 | 1.00500 | 0.999 | 2.2 | 99.8 | 1.5 | 100.9 | 0.3 | 1 |
| Anhydroecgonine methylester | 28 | 0.50500 | 0.999 | 2.4 | 98.7 | 2.3 | 101.1 | 0.1 | 0.5 |
| Morphine | 29 | 1.00500 | 0.998 | 2.5 | 97.5 | 2.9 | 99.1 | 0.3 | 1 |
| Pholcodine | 30 | 1.14500 | 0.999 | 3.3 | 99.2 | 4.7 | 99.5 | 0.35 | 1.14 |
| Atenolol | 31 | 0.10500 | 0.999 | 2.3 | 96.8 | 2.1 | 95.3 | 0.03 | 0.1 |
| Ranitidine | 32 | 5.17500 | 0.998 | 9.7 | 97.4 | 2.5 | 100.1 | 1.03 | 5.17 |
| Iopromide | 33 | 5.791 | 0.997 | 12 | 105.4 | 5 | 101.2 | 1.16 | 5.79 |
| Acetaminophen | 34 | 0.541 | 0.998 | 2.6 | 99 | 1.6 | 97.4 | 0.11 | 0.54 |
| Cimetidine | 35 | 0.52500 | 0.999 | 9 | 99.3 | 4.2 | 104.1 | 0.1 | 0.52 |
| Dihydrocodeine | 36 | 0.10500 | 0.999 | 2.1 | 94.6 | 1.6 | 94.2 | 0.03 | 0.1 |
| Codeine | 37 | 0.50500 | 0.997 | 4 | 95.1 | 2 | 93.5 | 0.1 | 0.5 |
| Norephedrine | 38 | 0.501 | 0.999 | 5.1 | 95.2 | 4.3 | 96.3 | 0.01 | 0.5 |
| Norcodeine | 39 | 1.00500 | 0.998 | 4.8 | 98.6 | 2.8 | 98.5 | 0.3 | 1 |
| 1 | 40 | 1.00500 | 0.999 | 9.9 | 94.9 | 6 | 94.3 | 0.3 | 1 |
| Lisinopril | 41 | 0.93400 | 0.995 | 7.2 | 95.2 | 2.2 | 97.2 | 0.09 | 0.93 |
| Ephedrine/pseudoephedrine | 42 | 0.10500 | 0.997 | 3.4 | 97.3 | 4.1 | 94 | 0.03 | 0.1 |
| Cotinine | 43 | 0.051 | 0.999 | 1.5 | 98.8 | 1.5 | 98.4 | 0.01 | 0.05 |
| 6-Acetylmorphine | 44 | 0.10500 | 0.997 | 5.1 | 100.1 | 6.1 | 95.3 | 0.03 | 0.1 |
| Azathioprine | 45 | 0.10500 | 0.999 | 13.9 | 97.4 | 7.6 | 97.5 | 0.03 | 0.1 |
| Methotrexate | 46 | 0.92500 | 0.997 | 4.1 | 112.2 | 8.7 | 108 | 0.28 | 0.92 |
| Caffeine | 47 | 0.50500 | 0.999 | 2.8 | 100.4 | 1.7 | 99.6 | 0.1 | 0.5 |
| O-desmethyltramadol | 48 | 1.00400 | 0.997 | 4.9 | 98.5 | 3.3 | 95.3 | 0.01 | 1 |
| Amphetamine | 49 | 0.10500 | 0.999 | 1.6 | 100.7 | 4.4 | 100.8 | 0.03 | 0.1 |
| Trimethoprim | 50 | 0.10500 | 0.998 | 2.2 | 99.5 | 3 | 96.9 | 0.03 | 0.1 |
| Methamphetamine | 51 | 0.10500 | 0.999 | 1.3 | 101.1 | 2.2 | 101 | 0.03 | 0.1 |
| MDA | 52 | 0.101 | 0.998 | 0.7 | 100 | 1.1 | 98.4 | 0.03 | 0.1 |
| MDMA | 53 | 0.051 | 0.999 | 1.7 | 99.8 | 1.3 | 99.2 | 0.01 | 0.05 |
| Sulfamethoxazole | 54 | 0.101 | 0.999 | 2.4 | 96 | 3.5 | 95.1 | 0.03 | 0.1 |
| Benzoylecgoninea | 55 | 0.0510050500 | 0.9980.999 | 0.9 | 103.2 | 2.4 | 103.4 | 0.01 | 0.05 |
| Mephedrone | 56 | 0.05500 | 0.998 | 2.9 | 85.7 | 1.8 | 87.1 | 0.01 | 0.05 |
| Ketamine | 57 | 0.05500 | 0.998 | 1.3 | 93.6 | 1.8 | 92.5 | 0.01 | 0.05 |
| Desmethylvenlafaxine | 58 | 0.10500 | 0.998 | 2.1 | 102.3 | 2.8 | 101.3 | 0.03 | 0.1 |
| Heroin | 59 | 0.50500 | 0.999 | 1.8 | 99.3 | 1.9 | 98.2 | 0.1 | 0.5 |
| Tramadol | 60 | 1.00500 | 0.999 | 1.9 | 98.4 | 1.6 | 100.1 | 0.01 | 1 |
| Norketamine | 61 | 0.10500 | 0.999 | 3.2 | 94 | 1.8 | 94.1 | 0.03 | 0.1 |
| Metoprolol | 62 | 0.05500 | 0.999 | 2 | 96.1 | 1.3 | 96.8 | 0.01 | 0.05 |
| Cocaine | 63 | 0.05500 | 0.999 | 1.5 | 99 | 2.2 | 97.2 | 0.01 | 0.05 |
| N-desmethyltramadol | 64 | 0.50500 | 0.998 | 2.2 | 94.4 | 2.5 | 92.5 | 0.01 | 0.5 |
| MDPV | 65 | 0.05500 | 0.999 | 0.7 | 101.4 | 2.2 | 99.6 | 0.01 | 0.05 |
| Ifosfamide | 66 | 0.05500 | 0.999 | 2.7 | 95.3 | 2.4 | 93.6 | 0.01 | 0.05 |
| Cocaethylene | 67 | 0.05500 | 0.999 | 1.7 | 94.7 | 2.8 | 95.1 | 0.01 | 0.05 |
| Carbamazepine10 | 68 | 0.101 | 0.997 | 2.1 | 89.9 | 1.6 | 88.9 | 0.03 | 0.1 |
| 10 | 69 | 0.501 | 0.997 | 5.6 | 93.8 | 2.8 | 92.2 | 0.05 | 0.5 |
| Mirtazapinea | 70 | 0.0510050500 | 0.9990.997 | 2.7 | 97.6 | 3.4 | 94.8 | 0.01 | 0.05 |
| Azithromycin | 71 | 0.11500 | 0.998 | 2.1 | 98.5 | 3.8 | 95 | 0.03 | 0.11 |
| Venlafaxine | 72 | 0.04500 | 0.998 | 1.7 | 90.5 | 2.5 | 91.2 | 0.01 | 0.04 |
| EDDP | 73 | 0.05500 | 0.999 | 1.1 | 96.4 | 1.2 | 96.5 | 0.01 | 0.05 |
| Citalopram | 74 | 0.501 | 0.999 | 2.6 | 101.8 | 0.7 | 101.2 | 0.05 | 0.5 |
| Propranolol | 75 | 0.09500 | 0.999 | 1 | 106.2 | 2 | 105.4 | 0.03 | 0.09 |
| Desmethylcitalopram | 76 | 0.05500 | 0.998 | 3 | 103.4 | 1.8 | 103 | 0.01 | 0.05 |
| Carbamazepine | 77 | 0.05500 | 1 | 1.6 | 92.7 | 2 | 91.7 | 0.01 | 0.05 |
| Diltiazem | 78 | 0.10500 | 0.996 | 2.3 | 93.6 | 2.3 | 92.7 | 0.01 | 0.1 |
| Tylosin | 79 | 0.56500 | 0.999 | 4 | 100.2 | 2.2 | 99.5 | 0.11 | 0.56 |
| Methadone | 80 | 0.05400 | 0.998 | 1.4 | 100.2 | 1.5 | 98.7 | 0.01 | 0.05 |
| Gliclazide | 81 | 0.05500 | 0.997 | 2.8 | 95.3 | 2.1 | 93.2 | 0.01 | 0.05 |
| Quetiapine | 82 | 0.051 | 0.997 | 1.2 | 96.4 | 1.4 | 95.3 | 0.01 | 0.05 |
| Temazepam | 83 | 0.05500 | 0.998 | 1.6 | 97.9 | 1 | 97 | 0.01 | 0.05 |
| Fluoxetine | 84 | 0.051 | 0.999 | 1.8 | 98.3 | 1.7 | 96.8 | 0.01 | 0.05 |
| Norfluoxetine | 85 | 0.05500 | 0.998 | 3.1 | 103.1 | 1.5 | 102.7 | 0.01 | 0.05 |
| Cetirizine | 86 | 0.08500 | 0.999 | 1.3 | 100.8 | 1.3 | 100.5 | 0.02 | 0.08 |
| Clarithromycin | 87 | 0.06500 | 0.999 | 2.4 | 101.8 | 2.6 | 99.8 | 0.01 | 0.06 |
| Sertraline | 88 | 0.05500 | 1 | 1.7 | 95.7 | 1.6 | 95.3 | 0.01 | 0.05 |
| 3-Benzophenone | 89 | 0.05400 | 0.995 | 4.5 | 86.8 | 3.2 | 84.9 | 0.01 | 0.05 |
| Tamoxifen | 90 | 0.031 | 0.998 | 2.4 | 96.8 | 4 | 96 | 0.01 | 0.03 |
Sample extraction and matrix effects
For the extraction of ECs from liquid samples a previously reported methodology by Kasprzyk–Hordern et al [31]. was applied. The Oasis HLB SPE sorbent was used as it utilises both hydrophilic and lipophilic retention mechanisms at neutral pH. Consequently it is suitable for the simultaneous extraction of a broad range of chemicals and has been widely applied for a large number of ECs in various environmental matrices [4] and [7]. However, during the development process it was found that the very polar compounds metformin and creatinine were recovered by <1% in all matrices studied. Nevertheless, they are commonly observed in environmental matrices at concentrations >1,000 ng L−1[6] and [32]. Such concentrations are sufficient to monitor by direct injection, without the need for SPE. A different sample preparation method was proposed for these compounds and involved simply filtering the sample, spiking with internal standards and adjusting to 20% MeOH to avoid chromatography issues such as band broadening (Fig. 1). This avoided the need for a separate SPE protocol to encompass all compounds studied. Furthermore, this approach was used to analyse acetaminophen, caffeine, nicotine and 1,7 dimethylxanthine in crude wastewater due to their relatively high concentrations observed here. Otherwise, extracts would require to be diluted and re-analysed to ensure they fall within their respective calibration ranges. Therefore, overall analysis time was not compromised by applying direct injection as well as SPE. A disadvantage of using Oasis HLB SPE is that it is non-selective and co-extracted matrix can cause significant analyte signal suppression when using ESI [4]. To demonstrate, in crude wastewater matrix suppressions up to 90% (pholcodine) are observed (Fig. 4). Signal enhancement can also be observed [4], particularly in ESI- mode. This illustrates the necessity of using internal standards to correct for these matrix interferences (and any losses during sample preparation). Absolute and corrected recoveries (accounting for internal standard losses) are detailed in Fig. 5 and Table S5.
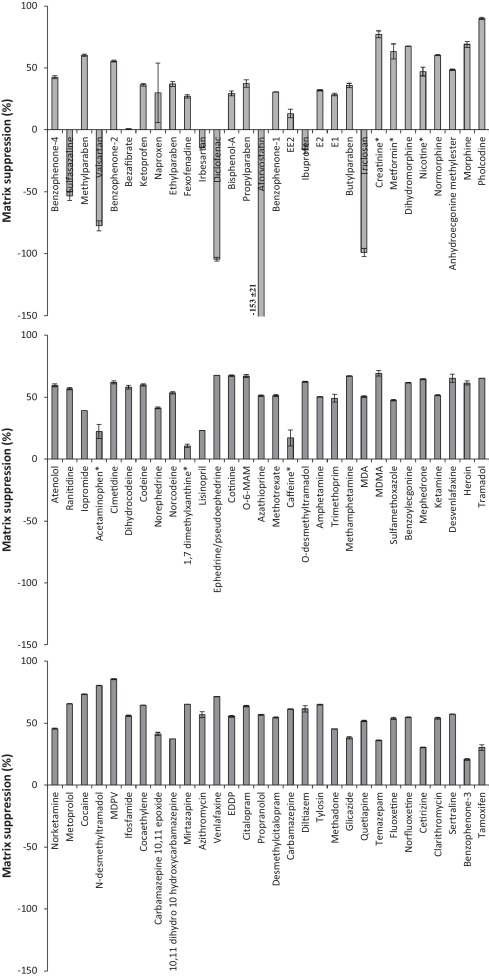
Fig. 4.
Matrix suppression of target EC response in crude wastewater extracts (ordered by retention time). Compounds marked with * were determined by direct injection (no SPE).
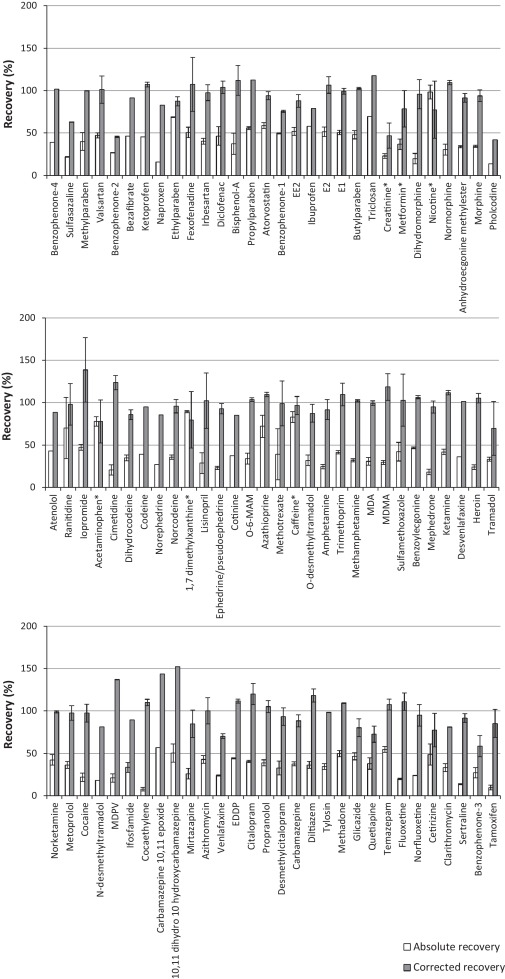
Fig. 5.
Absolute and corrected recovery of target ECs in crude wastewater spiked at 100 and 1000 ng L−1, respectively (ordered by retention time). Those marked with * were determined by direct injection (no SPE).
During development of the method for solid matrices, very low or no recovery was observed for many compounds determined in ESI + mode. The very complex nature of extracts from digested sludge quenched analyte signal during ESI. This was confirmed by spiking extracts post SPE, demonstrating that non-selective Oasis HLB SPE was unsuitable for solid extracts (dilution of extracts was also insufficient for reducing matrix interferences and improving sensitivity). To overcome this issue, fractionation of acidic/basic analytes during SPE was investigated. This involved eluting acidic and basic fractions into separate SPE vials to reduce matrix interferences. Oasis MAX and MCX were trialled and found to be successful at reducing matrix suppression significantly. The cation-exchange mixed-mode polymeric sorbent (MCX) was chosen as it provided the greatest recoveries. For this method, samples were adjusted to pH 2 to ionise basic compounds prior to SPE [6]. Acidic compounds were eluted from the cartridge in 2 mL of 0.6% HCOOH in MeOH (fraction 1) and basic compounds separately in 3 mL 7% NH4OH in MeOH (fraction 2), similar to the method reported by Baker and Kasprzyk-Hordern [6]. Development of the MAE method involved investigating the impact of solvent composition and extraction temperature on analyte recovery. A solvent mixture comprising 50:50 H2O:MeOH (pH 2) and an extraction temperature of 110 °C gave the best recoveries (Fig. S1). These conditions are similar to other previously reported MAE methods [14], [15], [16] and [17]. Extraction at pH 2 was selected as it is beneficial to some compounds such as benzophenones [16] and is the pH required for SPE. The developed method was suitable for the determination of 63 of the 90 ECs studied (70%) (Table 2). To our knowledge, this is considerably more than previously reported MAE methods [14], [15], [16] and [17]. The remaining ECs which could not be analysed using the described method were poorly extracted during MAE or were not recovered using the SPE method applied. This includes some ECs identified in proposed EU legislation such as azithromycin and clarithromycin. These ECs would require a different method(s), more targeted towards their specific analysis needs. This outlines the difficulty of undertaking multi-residue analysis of such complex solid wastewater matrices. Recoveries from digested sludge ranged from 49 to 180% with the majority of compounds exhibiting recoveries in the range 90-110% (Table S5). In contrast to liquid extracts, no signal enhancement was observed for any of the ECs studied. This is owed to the increased complexity of digested sludge extracts. Matrix suppressions ranged from 27.5% for dihydromorphine to 88.6% for naproxen (Table S6).
Method detection limits and method quantitation limits for target ECs in crude wastewater, final effluent, river water and digested sludge (ordered by retention time).
Key: MDL, method detection limit; MQL, method quantitation limit.
*Determined by direction injection (i.e., no SPE performed); -Compound was not extracted or failed quality control criteria.
| Chemical | Crude wastewater | Final effluent | River water | Digested sludge | ||||
|---|---|---|---|---|---|---|---|---|
| MDL (ng L?1) | MQL (ng L?1) | MDL (ng L?1) | MQL (ng L?1) | MDL (ng L?1) | MQL (ng L?1) | MDL (ng g?1) | MQL (ng g?1) | |
| Chemicals determined in ESI - mode | ||||||||
| 4-benzophenone | 7.83 | 25.84 | 5.78 | 19.09 | 2.09 | 6.9 | 4.01 | 13.22 |
| Sulfasalazine | 12.55 | 41.43 | 9.66 | 31.87 | 4.31 | 14.23 | - | - |
| Methylparaben | 0.28 | 1.41 | 0.19 | 0.94 | 0.08 | 0.4 | 0.06 | 0.31 |
| Valsartan | 7.24 | 23.9 | 6.4 | 21.12 | 2.81 | 9.26 | - | - |
| 2-benzophenone | 0.36 | 1.82 | 0.34 | 1.68 | 0.16 | 0.79 | 0.09 | 0.44 |
| Bezafibrate | 0.64 | 2.11 | 0.38 | 1.25 | 0.22 | 0.66 | 0.18 | 0.6 |
| Ketoprofen | 2.38 | 11.9 | 1.6 | 8 | 0.74 | 3.72 | 0.47 | 2.35 |
| Naproxen | 6.29 | 31.45 | 1.17 | 5.85 | 0.61 | 3.07 | 0.6 | 3.02 |
| Ethylparaben | 0.49 | 1.61 | 0.46 | 1.52 | 0.24 | 0.79 | 0.17 | 0.57 |
| Fexofenadine | 0.56 | 1.85 | 0.4 | 1.32 | 0.21 | 0.69 | - | - |
| Irbesartan | 2.5 | 12.49 | 1.88 | 9.38 | 0.89 | 4.47 | - | - |
| Diclofenac | 0.67 | 2.22 | 0.44 | 1.44 | 0.22 | 0.73 | 0.75 | 2.46 |
| Bisphenol A | 0.85 | 2.79 | 0.56 | 1.84 | 0.26 | 0.86 | 0.27 | 0.88 |
| Propylparaben | 0.63 | 2.08 | 0.47 | 1.54 | 0.25 | 0.83 | 0.22 | 0.72 |
| Atorvastatin | 0.17 | 0.85 | 0.17 | 0.84 | 0.14 | 0.7 | - | - |
| 1-Benzophenone | 0.23 | 1.15 | 0.14 | 0.71 | 0.07 | 0.35 | 0.14 | 0.7 |
| EE2 | 1.83 | 9.15 | 1.46 | 7.32 | 0.98 | 4.91 | - | - |
| Ibuprofen | 0.19 | 0.93 | 0.08 | 0.42 | 0.06 | 0.31 | 0.07 | 0.36 |
| E2 | 1.84 | 9.22 | 1.41 | 7.03 | 0.9 | 4.48 | 1.48 | 7.41 |
| E1 | 1.96 | 9.78 | 1.54 | 7.69 | 0.78 | 3.92 | 1.68 | 8.38 |
| Butylparaben | 0.24 | 1.21 | 0.14 | 0.71 | 0.08 | 0.38 | 0.1 | 0.52 |
| Triclosan | 4.93 | 16.27 | 4.55 | 15.02 | 2.93 | 9.68 | - | - |
| Chemicals determined in ESI + mode | ||||||||
| Creatinine | 945* | 3,118* | 771* | 2,544* | 511* | 1,686* | - | - |
| Metformin | 457* | 1,509* | 163* | 460* | 156* | 515* | - | - |
| Dihydromorphine | 0.5 | 2.51 | 0.32 | 1.59 | 0.11 | 0.55 | 0.09 | 0.45 |
| Nicotine | 508* | 2,296* | 5.44 | 17.95 | 3.34 | 11.03 | 0.66 | 2.19 |
| Normorphine | 9.99 | 32.96 | 7.84 | 25.88 | 3.54 | 11.67 | 1.74 | 5.75 |
| Anhydroecgonine methylester | 2.95 | 14.76 | 1.99 | 9.96 | 0.93 | 4.67 | - | - |
| Morphine | 8.85 | 29.2 | 6.34 | 20.92 | 2.65 | 8.75 | 1.92 | 6.33 |
| Pholcodine | 25.25 | 83.32 | 8.02 | 26.45 | 2.25 | 7.42 | 1.52 | 5 |
| Atenolol | 0.71 | 2.35 | 0.56 | 1.84 | 0.2 | 0.66 | 0.1 | 0.33 |
| Ranitidine | 14.76 | 73.79 | 22.28 | 111.39 | 7.96 | 39.79 | 4.81 | 24.05 |
| Iopromide | 24.51 | 123 | 14.11 | 70.56 | 5.97 | 29.85 | - | - |
| Acetaminophen | 138* | 1,017* | 2.39 | 11.95 | 1.2 | 6.02 | 2.74 | 13.72 |
| Cimetidine | 5.06 | 25.32 | 3.12 | 15.59 | 1.6 | 7.98 | - | - |
| Dihydrocodeine | 0.88 | 2.89 | 0.55 | 1.83 | 0.23 | 0.75 | 0.11 | 0.36 |
| Codeine | 2.56 | 12.82 | 1.46 | 7.31 | 0.74 | 3.71 | 0.33 | 1.66 |
| Norephedrine | 0.37 | 18.6 | 0.35 | 17.28 | 0.18 | 8.82 | 0.04 | 1.85 |
| Norcodeine | 8.53 | 28.15 | 8.32 | 27.44 | 2.88 | 9.52 | 1.26 | 4.17 |
| 1 | 560* | 2,165* | 11.4 | 37.63 | 3.19 | 10.53 | - | - |
| Lisinopril | 3.25 | 32.54 | 4.25 | 42.51 | 2.17 | 21.73 | 0.25 | 2.47 |
| Ephedrine/pseudoephedrine | 1.32 | 4.36 | 1.62 | 5.36 | 0.6 | 1.97 | 0.11 | 0.35 |
| Cotinine | 0.27 | 1.34 | 0.21 | 1.06 | 0.07 | 0.35 | 0.24 | 1.22 |
| 6-Acetylmorphine | 0.89 | 2.95 | 0.76 | 2.5 | 0.28 | 0.94 | - | - |
| Azathioprine | 0.41 | 1.36 | 0.36 | 1.2 | 0.17 | 0.55 | - | - |
| Methotrexate | 7.11 | 23.45 | 9.04 | 29.83 | 6.13 | 20.24 | 1.64 | 5.42 |
| Caffeine | 121* | 581* | 1.11 | 5.57 | 0.37 | 1.83 | - | - |
| O-desmethyltramadol | 0.31 | 31.41 | 0.28 | 27.79 | 0.09 | 8.53 | - | - |
| Amphetamine | 1.23 | 4.07 | 1.11 | 3.65 | 0.68 | 2.23 | 0.09 | 0.29 |
| Trimethoprim | 0.73 | 2.41 | 0.51 | 1.67 | 0.26 | 0.85 | 0.07 | 0.22 |
| Methamphetamine | 0.95 | 3.13 | 0.71 | 2.35 | 0.32 | 1.05 | 0.09 | 0.3 |
| MDA | 0.99 | 3.26 | 1 | 3.3 | 0.53 | 1.74 | - | - |
| MDMA | 0.34 | 1.7 | 0.27 | 1.35 | 0.1 | 0.5 | 0.04 | 0.18 |
| Sulfamethoxazole | 0.72 | 2.38 | 0.47 | 1.56 | 0.19 | 0.63 | 0.12 | 0.41 |
| Benzoylecgonine | 0.21 | 1.07 | 0.18 | 0.91 | 0.07 | 0.34 | 0.03 | 0.14 |
| Mephedrone | 0.55 | 2.75 | 0.44 | 2.19 | 0.22 | 1.09 | 0.06 | 0.31 |
| Ketamine | 0.24 | 1.2 | 0.19 | 0.93 | 0.07 | 0.37 | 0.03 | 0.17 |
| Desmethylvenlafaxine | 0.85 | 2.79 | 0.66 | 2.18 | 0.24 | 0.8 | 0.09 | 0.29 |
| Heroin | 4.18 | 20.89 | 3.44 | 17.21 | 0.92 | 4.62 | 0.56 | 2.79 |
| Tramadol | 0.3 | 30.03 | 0.21 | 21.29 | 0.08 | 8.2 | 0.03 | 3.26 |
| Norketamine | 0.72 | 2.37 | 0.56 | 1.86 | 0.23 | 0.76 | 0.1 | 0.33 |
| Metoprolol | 0.28 | 1.4 | 0.19 | 0.96 | 0.07 | 0.35 | 0.03 | 0.14 |
| Cocaine | 0.46 | 2.31 | 0.22 | 1.11 | 0.07 | 0.35 | 0.03 | 0.15 |
| N-desmethyltramadol | 0.56 | 27.9 | 0.3 | 14.97 | 0.12 | 5.92 | 0.04 | 2.02 |
| MDPV | 0.48 | 2.41 | 0.12 | 0.59 | 0.04 | 0.22 | 0.04 | 0.2 |
| Ifosfamide | 0.31 | 1.53 | 0.24 | 1.22 | 0.08 | 0.4 | - | - |
| Cocaethylene | 1.31 | 6.54 | 0.21 | 1.04 | 0.07 | 0.35 | 0.03 | 0.17 |
| Carbamazepine10 | 0.53 | 1.76 | 0.55 | 1.82 | 0.16 | 0.53 | - | - |
| 10 | 0.99 | 9.94 | 0.84 | 8.41 | 0.34 | 3.37 | 0.43 | 4.35 |
| Mirtazapine | 0.39 | 1.94 | 0.25 | 1.25 | 0.09 | 0.44 | 0.05 | 0.27 |
| Azithromycin | 0.74 | 2.45 | 1.35 | 4.45 | 0.7 | 2.3 | - | - |
| Venlafaxine | 0.37 | 1.83 | 0.24 | 1.2 | 0.07 | 0.37 | 0.08 | 0.38 |
| EDDP | 0.23 | 1.13 | 0.29 | 1.47 | 0.21 | 1.05 | 0.04 | 0.2 |
| Citalopram | 1.24 | 12.4 | 1.41 | 14.1 | 0.61 | 6.08 | 0.16 | 1.64 |
| Propranolol | 0.68 | 2.25 | 0.73 | 2.41 | 0.29 | 0.96 | 0.13 | 0.42 |
| Desmethylcitalopram | 0.31 | 1.54 | 0.36 | 1.82 | 0.14 | 0.69 | 0.05 | 0.24 |
| Carbamazepine | 0.27 | 1.37 | 0.19 | 0.93 | 0.08 | 0.38 | 0.1 | 0.48 |
| Diltiazem | 0.27 | 2.68 | 0.32 | 3.23 | 0.11 | 1.11 | - | - |
| Tylosin | 3.27 | 16.34 | 2.23 | 11.14 | 1.28 | 6.39 | - | - |
| Methadone | 0.2 | 1.01 | 0.21 | 1.04 | 0.11 | 0.54 | 0.03 | 0.17 |
| Gliclazide | 0.22 | 1.09 | 0.16 | 0.82 | 0.15 | 0.77 | - | - |
| Quetiapine | 0.26 | 1.32 | 0.21 | 1.07 | 0.1 | 0.48 | 0.05 | 0.26 |
| Temazepam | 0.18 | 0.92 | 0.14 | 0.69 | 0.08 | 0.38 | 0.16 | 0.82 |
| Fluoxetine | 0.5 | 2.52 | 1.42 | 7.08 | 1.14 | 5.71 | 0.11 | 0.53 |
| Norfluoxetine | 0.42 | 2.12 | 1.27 | 6.35 | 1.64 | 8.21 | 0.14 | 0.68 |
| Cetirizine | 0.52 | 1.72 | 0.32 | 1.06 | 0.26 | 0.87 | - | - |
| Clarithromycin | 0.34 | 1.69 | 0.28 | 1.4 | 0.18 | 0.9 | - | - |
| Sertraline | 0.74 | 3.72 | 1.21 | 6.05 | 1.61 | 8.07 | 0.17 | 0.86 |
| 3-benzophenone | 0.37 | 1.87 | 0.19 | 0.97 | 0.15 | 0.77 | - | - |
| Tamoxifen | 0.7 | 3.5 | 0.76 | 3.82 | 14.52 | 72.6 | 2.23 | 11.14 |
Method sensitivity
The final method achieved MDLs <0.1 ng L−1 for numerous ECs in liquid environmental samples (Table 2). MQLs achieved were <1 ng L−1 for several compounds up to a maximum of 171 ng L−1 for ranitidine in wastewater samples where SPE was applied (Table 2). This range of MQLs is typical for multi-residue methods [7] and [8]. The MQLs of E1 and E2 in wastewaters were in the range 7.03–13.7 ng L−1 and suitable for the concentrations expected to be encountered in municipal wastewaters [1] and [24]. This is advantageous as these compounds have not previously been quantifiable in multi-residue methods (>50 compounds) which extract relatively low sample volumes (50 mL). The improvement in sensitivity (and MQL) was attributable to the application of NH4F as a negative ion buffer. However, the very low concentrations anticipated for EE2 (<1 ng L−1[24]) continues to be a challenge and are below the MQL for the methodology reported here. For those compounds analysed by direct injection (metformin, creatinine, acetaminophen, 1,7 dimethylxantine, caffeine and nicotine), MQLs in crude wastewater ranged from 700 ng L−1 for caffeine to 13,657 ng L−1 for creatinine (Table 2). Despite being significantly higher than those reported for compounds where SPE was applied, these MQLs were sufficient for their determination as these ECs are found in comparatively higher concentrations (Table 3). In digested sludge, MDLs ranged from 0.03 to 4.81 ng g−1 and MQLs from 0.14 to 24.05 ng g−1 (Table 2). Despite these being similar to previously reported PLE methods [18], the MAE reported here required lower solvent volumes for extraction. MAE systems are also cheaper to purchase and run than PLE. Furthermore, sample preparation for MAE is more straightforward and it offers the ability to perform several extractions simultaneously.
Quantitative information for target ECs in crude wastewater, final effluent, river water and digested sludge (n = 3) (ordered by chemical class).
Key: MQL, method quantitation limit.
a: Removal(%)=(CW−FE)/CW×100 where CW is the crude wastewater concentration (ng L1) and FE is the final effluent concentration (ng L1).
b: Metabolite
| Chemical class | Chemical | Crude wastewater(ng L-1) | Final effluent (ng L-1) | Removala(%) | River water(ng L-1) | Digested sludge (ng g-1dry weight) |
|---|---|---|---|---|---|---|
| UV filters | Benzophenone-1 | 145 ± 10.0 | | >99 | 86.1 ± 25.8 |
| |
| Benzophenone-2 | | - |
| | |||
| Benzophenone-3 | 369 ± 10.1 | 91.4 ± 5.7 | 75 | 65.7 ± 11.3 | - | |
| Benzophenone-4 | 3,298 ±313 | 3,860 ± 329 | ?17 | 207 ± 11.8 | |
| |
| Parabens | Methylparaben | 1,196 ± 102 | 6.4 ± 0.6 | 99 | 10.8 ± 2.5 | 219 ± 81.2 |
| Ethylparaben | 357 ± 15.1 | 6.3 ± 0.6 | 98 | 1.8 ± 0.3 | |
| |
| Propylparaben | 722 ± 55.2 | 5.8 ± 2.6 | 99 | |
| | |
| Butylparaben | 38.3 ± 2.6 | | >98 |
| | ||
| Plasticizer | Bisphenol-A | 624 ± 126 | 205 ± 14.5 | 67 | 62.3 ± 17.0 | 5,800 ± 1,070 |
| Steroid estrogens | E1 | 44.5 ± 3.0 | 15.8 ± 4.6 | 64 | | 77.2 ± 1.1 |
|
| E2 | | - |
| | |||
| EE2 | | - | - |
| | ||
| Antibacterials/antibiotics | Sulfasalazine | | - | - |
| ||
| Clarithromycin | 907 ± 87.6 | 1,065 ± 121 | 17 | 43.5 ± 7.2 | - | |
| Azithromycin | 162 ± 17.0 | 87.2 ± 10.7 | 46 | | - |
| |
| Trimethoprim | 672 ± 23.3 | 769 ± 65.5 | 15 | 22.0 ± 3.1 | 21.5 ± 1.7 | |
| Sulfamethoxazole | 113 ± 14.1 | 47.5 ± 10.6 | 58 | 1.8 ± 0.2 | |
| |
| Triclosan | 1,053 ± 105 | 199 ± 20.6 | 81 | 101 ± 9.2 | - | |
| Hypertension | Valsartan | 322 ± 31.8 | 273 ± 6.4 | 15 | 38.1 ± 2.0 | - |
| Irbesartan | 152 ± 16.5 | 166 ± 8.1 | -9 | | - |
| |
| Lisinopril | | - |
| | |||
| NSAIDs | Ketoprofen | | - | | |||
| Ibuprofen | 12,907 ± 434 | 1,290 ± 16.8 | 90 | 27.5 ± 3.5 | 174 ± 4.2 | |
| Naproxen | 13,660 ± 541 | 3,516 ± 94.9 | 74 | 127 ± 7.8 | 39.8 ± 8.5 | |
| Diclofenac | 549 ± 49.1 | 436 ± 6.2 | 21 | 21.5 ± 3.6 | 23.5 ± 6.4 | |
| Acetaminophen | 138,164 ± 11,873 | 1,454 ± 77.8 | 99 | 163 ± 2.8 | 10.3 ± 3.6 | |
| Lipid regulators | Bezafibrate | 1,540 ± 120 | 892 ± 16.5 | 42 | 42.1 ± 0.8 | |
| Atorvastatin | 188 ± 12.5 | 60.5 ± 3.5 | 68 | 7.0 ± 1.1 | - | |
| Antihistamines | Fexofenadine | 770 ± 55.5 | 598 ± 7.9 | 22 | 63.7 ± 5.7 | - |
| Cetirizine | 1,571 ± 182 | 1,961 ± 147 | 25 | 195 ± 42.1 | - | |
| Diabetes | Metformin | 44,204 ± 900 | 19,784 ± 257 | 55 | 2,318 ± 63 | - |
| Gliclazide | 34.5 ± 2.8 | 30.0 ± 0.7 | 13 | | - |
| |
| Cough suppressant | Pholcodine | | - | 17.3 ± 0.5 |
| ||
| Beta-blocker | Atenolol | 1,689 ± 141 | 683 ± 148 | 60 | 20.1 ± 1.4 | 26.8 ± 0.4 |
| Metoprolol | 37.0 ± 4.9 | 43.1 ± 7.0 | 16 | | 1.0 ± 0.1 |
| |
| Propranolol | 122 ± 13.4 | 116 ± 12.0 | 5 | | 192 ± 5.1 |
| |
| H2 receptor agonists | Ranitidine | 781 ± 78.0 | 475 ± 6.6 | 39 | | 47.1 ± 3.1 |
|
| Cimetidine | 107 ± 14.1 | 148 ± 12.3 | 38 | | - |
| |
| X-ray contrast media | Iopromide | | - | - |
| ||
| Drug precursor and metabolite | Ephedrine/pseudoephedrine | 465 ± 17.7 | 125 ± 4.2 | 73 | | 15.1 ± 6.9 |
|
| Norephedrineb | | - |
| | |||
| Anti-cancer | Azathioprine | | - | - |
| ||
| Methotrexate | | - |
| | |||
| Ifosfamide | | - | - |
| | ||
| Tamoxifen | | - |
| | |||
| Anaesthetic and metabolite | Ketamine | | 9.5 ± 0.7 | - | 0.3 ± 0.1 |
| |
| Norketamineb | | - | 0.9 ± 0.2 |
| | ||
| Anti-depressants and metabolites | Venlafaxine | 387 ± 43.1 | 355 ± 24.0 | 8 | 31.1 ± 1.5 | 37.9 ± 0.2 |
| Desmethylvenlafaxineb | 86.3 ± 5.7 | 87.1 ± 4.1 | 1 | 7.3 ± 1.9 | 15.5 ± 0.7 | |
| Fluoxetine | 36.0 ± 11.3 | 26.5 ± 3.5 | 26 | | 188 ± 24.1 |
| |
| Norfluoxetineb | 38.5 ± 7.8 | 30.0 ± 2.8 | 22 | | 124 ± 0.9 |
| |
| Sertraline | 74.0 ± 25.4 | 47.0 ± 5.1 | 36 | | 1,138 ± 35.5 |
| |
| Mirtazapine | 60.0 ± 4.2 | 55.0 ± 2.8 | 8 | | 66.1 ± 0.4 |
| |
| Citalopram | 340 ± 31.1 | 323 ± 11.3 | 5 | | 657 ± 37.8 |
| |
| Desmethylcitalopramb | 80.0 ± 9.9 | 72.5 ± 0.7 | 9 | | 193 ± 12.0 |
| |
| Anti-epileptic and metabolites | Carbamazepine | 650 ± 46.0 | 316 ± 5.7 | 51 | 75.8 ± 12.0 | 121 ± 5.4 |
| Carbamazepine10 | 36.0 ± 1.4 | 42.0 ± 11.3 | 17 | | - |
| |
| 10,11-Dihydro-10-hydroxycarbamazepineb | 18.5 ± 3.5 | 103 ± 10.3 | 457 | |
| | |
| Calcium channel blocker | Diltiazem | 190 ± 5.0 | 41.8 ± 7.0 | 78 | | - |
|
| Hypnotic | Temazepam | 57.5 ± 3.5 | 121 ± 5.7 | 110 | ||
| Anti-psychotic | Quetiapine | 80.0 ± 7.1 | 2.0 ± 0.4 | 98 | | 23.3 ± 4.5 |
|
| Veterinary | Tylosin | | - | - |
| ||
| Human indicators and metabolites | Creatinineb | 83,125 ± 9,461 | | 94 | - |
| |
| Nicotine | 7,750 ± 937 | 148 ± 9.4 | 98 | 33.5 ± 5.1 | 139 ± 26.4 | |
| Caffeine | 74,813 ± 5,329 | 5,991 ± 157 | 92 | 247 ± 10.5 | - | |
| Cotinineb | 1,972 ± 285 | 360 ± 28.3 | 82 | 29.8 ± 2.1 | 47.6 ± 10.6 | |
| 1,7 dimethylxantineb | 146,500 ± 1,687 | 6,873 ± 367 | 95 | 345 ± 74.9 | - | |
| Analgaesics and metabolites | Morphine | 1,093 ± 78.4 | 202 ± 19.0 | 82 | | 277 ± 30.5 |
|
| Dihydromorphineb | | - | 28.5 ± 4.5 |
| | ||
| Normorphineb | 86.0 ± 2.8 | | >70 | 25.5 ± 3.3 |
| | |
| Methadone | 59.5 ± 7.0 | 28.0 ± 1.4 | 53 | | 24.6 ± 0.4 |
| |
| EDDPb | 106 ± 9.8 | 87.5 ± 6.4 | 17 | | 118 ± 1.6 |
| |
| Codeine | 1,290 ± 116.0 | 923 ± 21.2 | 28 | 32.0 ± 1.4 | 67.7 ± 8.6 | |
| Norcodeineb | 120 ± 15.5 | 84.5 ± 7.0 | 30 | |
| | |
| Dihydrocodeineb | 155 ± 14.8 | 232 ± 11.3 | 50 | 12.5 ± 2.8 | 24.2 ± 0.2 | |
| Tramadol | 897 ± 166 | 930 ± 84.1 | 4 | 131 ± 21.2 | 21.2 ± 0.9 | |
| N-desmethyltramadolb | 209 ± 4.2 | 341 ± 4.9 | 63 | 42.5 ± 7.1 | 8.7 ± 0.2 | |
| O-desmethyltramadolb | 978 ± 28.3 | 671 ± 33.5 | 31 | 95.0 ± 7.1 | - | |
| Stimulants and metabolites | Amphetamine | 288 ± 17 | 67.0 ± 1.4 | 77 | | 7.5 ± 0.2 |
|
| Methamphetamine | | - |
| | |||
| MDMA | 43.0 ± 5.8 | 56.5 ± 7.1 | 31 | | 10.3 ± 0.6 |
| |
| MDAb | | 16.0 ± 4.2 | <220 | - |
| | |
| Cocaine | 430 ± 39.6 | 72.5 ± 0.7 | 83 | | 3.1 ± 0.3 |
| |
| Benzoylecgonineb | 1,247 ± 70.7 | 389 ± 35.3 | 69 | 10.8 ± 2.1 | |
| |
| Anhydroecgonine methylesterb | | - | - |
| | ||
| Cocaethyleneb | | - |
| | |||
| Mephedrone | 27.5 ± 2.1 | | >92 |
| | ||
| MDPV | | - |
| | |||
| Opioid and metabolite | Heroin | | - | | |||
| 6-Acetylmorphineb | | - | - |
| |
Application to environmental matrices
The new multi-residue analytical method was applied to determine the concentration of ECs in crude wastewater and final effluent from a trickling filter WwTWs (population equivalent ∼105,000) in South-West England. Of the 90 compounds studied, 74% were found above the MQL in crude wastewater and 70% in final effluent (Table 3). In crude wastewater, concentrations of >100 μg L−1 for acetaminophen and 1,7 dimethylxanthine were observed. In final effluent, EC concentrations were expectedly lower. Nevertheless, several ECs (cetirizine, clarithromycin, acetaminophen, creatinine, metformin, ibuprofen, naproxen and 4-benzophenone) remained at concentrations ≥1,000 ng L−1 (Table 3). Although sample numbers were limited, collection of corresponding grab samples to account for HRT gave an insight into their removal by a trickling filter WwTWs. These are used extensively for wastewater treatment but receive less attention in comparison to other biological processes such as activated sludge [24]. Several compounds which have not been previously studied in the UK were poorly removed. For example, clarithromycin, gliclazide, fexofenadine, irbesartan and cetirizine were all removed by <25% (Table 3). Interestingly metabolites of carbamazepine (carbamazepine 10,11-epoxide and 10,11-dihydro-10-hydroxycarbamazepine) and tramadol (N-desmethyltramadol) increased in concentration during treatment. This observation has previously been observed for carbamazepine metabolites during trickling filter treatment[33]. It is proposed that this is caused by the transformation of other metabolites (e.g., glucuronides) or the parent compound during wastewater treatment [33]. Nevertheless, this requires more detailed investigation.
Water from an adjacent river (upstream of the wastewater discharge point) was also collected. Here, 37% of ECs investigated were above their respective MQL. Reported concentrations ranged from 1.8 ± 0.2 ng L−1 for sulfamethoxazole to 2318 ± 63 ng L−1 for metformin (Table 3). Metformin has been previously reported in river water at mean concentrations of ∼3,000 ng L−1[32]. This is attributed to its poor metabolism within the body, its widespread usage resulting in high crude wastewater concentration and poor removal during biological wastewater treatment (Table 3) [32]. Metabolites were also identified in river water at notable concentrations. For example, mean concentrations ofN-desmethyltramadol and O-desmethyltramadol were 42.5 ± 7.1 ng L−1 and 95.0 ± 7.1 ng L−1, respectively. Their presence at concentrations similar to the parent EC (tramadol 131.0 ± 21.2 ng L−1) demonstrates the importance of monitoring metabolites as well as the parent EC for fate understanding and the development of accurate environmental risk assessment.
Other than effluent discharges, another source of EC contamination in the environment is the application of digested sludge (biosolids) to agricultural land. In digested sludge, 41 of the 63 extractable ECs (65%) were found above the MQL (Table 3). Of these compounds, 13 were determined to be at concentrations >100 ng g−1 and considered to be significant. These were methylparaben, bisphenol-A, ibuprofen, propranolol, fluoxetine, norfluoxetine, sertraline, citalopram, desmethylcitalopram, carbamazepine, nicotine, morphine and EDDP. All antidepressants and their metabolites studied were found above their respective MQL. Furthermore, 5 of 8 antidepressants were determined at concentrations >100 ng g−1 highlighting the importance of studying this chemical type in solid matrices. Bisphenol-A was found at the highest concentration of 5800 ± 1,070 ng g−1. Due to the number of compounds detected as well as the concentrations reported, analysis of solid matrices should be considered for environmental monitoring [1]. However, there are a lack of suitable analytical approaches reported in the literature for such matrices. This method offers the opportunity to investigate the fate of a large number of ECs in solid matrices.
Conclusion
A new multi-residue method was developed for the determination of a high number of ECs in liquid (90) and solid (63) environmental matrices. The sensitivity of the method was demonstrated in real matrices whilst utilising low sample volumes/masses (50 mL for liquid samples and 0.5 g for solid samples). MQLs achievable were <1.0 ng L−1 in wastewaters and river water, and <1.0 ng g−1 in digested sludge. Application of the method revealed several metabolites increased in concentration during wastewater treatment demonstrating their analysis is necessary. Findings also revealed analysis of liquid samples needs supported with solids analysis. Thirteen ECs were found in digested sludge at concentrations >100 ng g−1 and up to a maximum of 5800 ± 1,070 ng g−1 for bisphenol-A. This method will be used to support monitoring studies to provide a greater understanding of the presence, fate and ecological impact of ECs in wastewaters and the environment.
Acknowledgements
The support of Wessex Water and the University of Bath’s EPSRC Impact Acceleration Account (Project number: EP/K503897/1 and ZR-Z0248) is greatly appreciated. The authors would like to thank Richard Standerwick from Wessex Water for his help throughout the project.
References
[1]
B. Petrie, R. Barden, B. Kasprzyk-Hordern
A review on emerging contaminants in wastewaters and the environment: current knowledge, understudied areas and recommendations for future monitoring
Water Res. (2014) http://dx.doi.org/10.1016/j.watres.2014.08.053
[2]
European Commission
European Commission Proposal for a Directive of the European Parliament and of the Council Amending Directives /60/EC
European Commission (2012)
[3]
R.N. Carvalho, L. Ceriani, A. Ippolito, T. Lettieri
Development of the first Watch List under the Environmental Quality Standard s Directive, JRC Technical Report
European Commission (2015)
[4]
B. Petrie, E.J. McAdam, M.D. Scrimshaw, J.N. Lester, E. Cartmell
Fate of drugs during wastewater treatment
TrAC Trends Anal. Chem., 49 (2013), pp. 145–159 http://dx.doi.org/10.1016/j.trac.2013.05.007
[5]
A. Garcia-Ac, P.A. Segura, L. Viglino, A. Fürtös, C. Gagnon, M. Prévost, et al.
On-line solid-phase extraction of large-volume injections coupled to liquid chromatography–tandem mass spectrometry for the quantitation and confirmation of 14 selected trace organic contaminants in drinking and surface water
J. Chromatogr. A, 1216 (2009), pp. 8518–8527 http://dx.doi.org/10.1016/j.chroma.2009.10.015
[6]
D.R. Baker, B. Kasprzyk-Hordern
Multi-residue analysis of drugs of abuse in wastewater and surface water by solid-phase extraction and liquid chromatography-positive electrospray ionisation tandem mass spectrometry
J. Chromatogr. A, 1218 (2011), pp. 1620–1631 http://www.scopus.com/inward/record.url?eid=2-s2.0-79952068519&partnerID=40&md5=71810e820d64e643464641f087726a78
[7]
M. Gros, S. Rodríguez-Mozaz, D. Barceló
Fast and comprehensive multi-residue analysis of a broad range of human and veterinary pharmaceuticals and some of their metabolites in surface and treated waters by ultra-high-performance liquid chromatography coupled to quadrupole-linear ion trap tandem
J. Chromatogr. A, 1248 (2012), pp. 104–121
[8]
R. López-Serna, M. Petrović, D. Barceló
Direct analysis of pharmaceuticals, their metabolites and transformation products in environmental waters using on-line TurboFlow™ chromatography–liquid chromatography–tandem mass spectrometry
J. Chromatogr. A, 1252 (2012), pp. 115–129 http://dx.doi.org/10.1016/j.chroma.2012.06.078
[9]
P. Vazquez-Roig, C. Blasco, Y. Pico
Advances in the analysis of legal and illegal drugs in the aquatic environment
TrAC Trends Anal. Chem., 50 (2013), pp. 65–77
[10]
C. Boix, M. Ibáñez, J.V. Sancho, J. Rambla, J.L. Aranda, S. Ballester, et al.
Fast determination of 40 drugs in water using large volume direct injection liquid chromatography–tandem mass spectrometry
Talanta, 131 (2015), pp. 719–727 http://dx.doi.org/10.1016/j.talanta.2014.08.005
[11]
A.L.N. van Nuijs, I. Tarcomnicu, W. Simons, L. Bervoets, R. Blust, P.G. Jorens, et al.
Optimization and validation of a hydrophilic interaction liquid chromatography–tandem mass spectrometry method for the determination of 13 top-prescribed pharmaceuticals in influent wastewater
Anal. Bioanal. Chem., 398 (2010), pp. 2211–2222 http://dx.doi.org/10.1007/s00216-010-4101-1
[12]
J. Martín, J.L. Santos, I. Aparicio, E. Alonso
Multi-residue method for the analysis of pharmaceutical compounds in sewage sludge, compost and sediments by sonication-assisted extraction and LC determination
J. Sep. Sci., 33 (2010), pp. 1760–1766 http://dx.doi.org/10.1002/jssc.200900873
[13]
N. Dorival-García, A. Zafra-Gómez, F.J. Camino-Sánchez, A. Navalón, J.L. Vílchez
Analysis of quinolone antibiotic derivatives in sewage sludge samples by liquid chromatography–tandem mass spectrometry: comparison of the efficiency of three extraction techniques
Talanta, 106 (2013), pp. 104–118 http://dx.doi.org/10.1016/j.talanta.2012.11.080
[14]
S. Morales, P. Canosa, I. Rodríguez, E. Rubí, R. Cela
Microwave assisted extraction followed by gas chromatography with tandem mass spectrometry for the determination of triclosan and two related chlorophenols in sludge and sediments
J. Chromatogr. A, 1082 (2005), pp. 128–135 http://dx.doi.org/10.1016/j.chroma.2005.05.059
[15]
T. Vega-Morales, Z. Sosa-Ferrera, J.J. Santana-Rodríguez
Determination of various estradiol mimicking-compounds in sewage sludge by the combination of microwave-assisted extraction and LC–MS/MS
Talanta, 85 (2011), pp. 1825–1834 http://dx.doi.org/10.1016/j.talanta.2011.07.051
[16]
K. Kotnik, T. Kosjek, U. Krajnc, E. Heath
Trace analysis of benzophenone-derived compounds in surface waters and sediments using solid-phase extraction and microwave-assisted extraction followed by gas chromatography–mass spectrometry
Anal. Bioanal. Chem., 406 (2014), pp. 3179–3190 http://dx.doi.org/10.1007/s00216-014-7749-0
[17]
S.E. Evans, P. Davies, A. Lubben, B. Kasprzyk-Hordern
Determination of chiral pharmaceuticals and illicit drugs in wastewater and sludge using microwave assisted extraction, solid-phase extraction and chiral liquid chromatography coupled with tandem mass spectrometry
Anal. Chim. Acta (2015) http://dx.doi.org/10.1016/j.aca.2015.03.039
[18]
D.R. Baker, B. Kasprzyk-Hordern
Multi-residue determination of the sorption of illicit drugs and pharmaceuticals to wastewater suspended particulate matter using pressurised liquid extraction, solid phase extraction and liquid chromatography coupled with tandem mass spectrometry
J. Chromatogr. A, 1218 (2011), pp. 7901–7913 http://dx.doi.org/10.1016/j.chroma.2011.08.092
[19]
N. Mastroianni, C. Postigo, M.L. de Alda, D. Barcelo
Illicit and abused drugs in sewage sludge: method optimization and occurrence
J. Chromatogr. A, 1322 (2013), pp. 29–37 http://dx.doi.org/10.1016/j.chroma.2013.10.078
[20]
P. Vazquez-Roig, R. Segarra, C. Blasco, V. Andreu, Y. Pico
Determination of pharmaceuticals in soils and sediments by pressurized liquid extraction and liquid chromatography tandem mass spectrometry
J. Chromatogr. A, 1217 (2010), pp. 2471–2483
[21]
O. Zuloaga, P. Navarro, E. Bizkarguenaga, A. Iparraguirre, A. Vallejo, M. Olivares, et al.
Overview of extraction, clean-up and detection techniques for the determination of organic pollutants in sewage sludge: a review
Anal. Chim. Acta, 736 (2012), pp. 7–29 http://dx.doi.org/10.1016/j.aca.2012.05.016
[22]
C. Postigo, M.J.L. de Alda, D. Barceló
Fully automated determination in the low nanogram per liter level of different classes of drugs of abuse in sewage water by on-line solid-phase extraction-liquid chromatography-electrospray-tandem mass spectrometry
Anal. Chem., 80 (2008), pp. 3123–3134 http://dx.doi.org/10.1021/ac702060j
[23]
R. López-Roldán, M.L. de Alda, M. Gros, M. Petrovic, J. Martín-Alonso, D. Barceló
Advanced monitoring of pharmaceuticals and estrogens in the Llobregat River basin (Spain) by liquid chromatography-triple quadrupole-tandem mass spectrometry in combination with ultra performance liquid chromatography-time of flight-mass spectrometry
Chemosphere, 80 (2010), pp. 1337–1344 http://dx.doi.org/10.1016/j.chemosphere.2010.06.042
[24]
B. Petrie, E.J. McAdam, K.H. Richards, J.N. Lester, E. Cartmell
Application of ultra-performance liquid chromatography-tandem mass spectrometry for the determination of steroid oestrogens in wastewaters
Int. J. Environ. Anal. Chem., 93 (2013), pp. 1343–1355 http://dx.doi.org/10.1080/03067319.2012.717272
[25]
N.A. Al-Odaini, M.P. Zakaria, M.I. Yaziz, S. Surif
Multi-residue analytical method for human pharmaceuticals and synthetic hormones in river water and sewage effluents by solid-phase extraction and liquid chromatography–tandem mass spectrometry
J. Chromatogr. A, 1217 (2010), pp. 6791–6806 http://dx.doi.org/10.1016/j.chroma.2010.08.033
[26]
N.H. Tran, J. Hu, S.L. Ong
Simultaneous determination of PPCPs, EDCs, and artificial sweeteners in environmental water samples using a single-step SPE coupled with HPLC–MS/MS and isotope dilution
Talanta, 113 (2013), pp. 82–92 http://dx.doi.org/10.1016/j.talanta.2013.03.072
[27]
E. Carmona, V. Andreu, Y. Pico
Occurrence of acidic pharmaceuticals and personal care products in Turia River Basin: from waste to drinking water
Sci. Total Environ., 484 (2014), pp. 53–63
[28]
O. Yanes, R. Tautenhahn, G.J. Patti, G. Siuzdak
Expanding coverage of the metabolome for global metabolite profiling
Anal. Chem., 83 (2011), pp. 2152–2161 http://dx.doi.org/10.1021/ac102981k
[29]
C. Ripollés, M. Ibáñez, J.V. Sancho, F.J. López, F. Hernández
Determination of 17β-estradiol and 17α-ethinylestradiol in water at sub-ppt levels by liquid chromatography coupled to tandem mass spectrometry
Anal. Methods, 6 (2014), p. 5028 http://dx.doi.org/10.1039/c4ay00479e
[30]
Official Journal of the European Communities Commission decision (2002/657/EC): implementing Council Directive 96/23/EC concerning the performance of analytical methods and the interpretation of results Available from: http://faolex.fao.org/docs/pdf/eur49615.pdf 2002
[31]
B. Kasprzyk-Hordern, V.V.R. Kondakal, D.R. Baker
Enantiomeric analysis of drugs of abuse in wastewater by chiral liquid chromatography coupled with tandem mass spectrometry
J. Chromatogr. A, 1217 (2010), pp. 4575–4586 http://dx.doi.org/10.1016/j.chroma.2010.04.073
[32]
M. Scheurer, A. Michel, H.-J. Brauch, W. Ruck, F. Sacher
Occurrence and fate of the antidiabetic drug metformin and its metabolite guanylurea in the environment and during drinking water treatment
Water Res., 46 (2012), pp. 4790–4802 http://dx.doi.org/10.1016/j.watres.2012.06.019
[33]
M. Leclercq, O. Mathieu, E. Gomez, C. Casellas, H. Fenet, D. Hillaire-Buys
Presence and fate of carbamazepine, oxcarbazepine, and seven of their metabolites at wastewater treatment plants
Arch. Environ. Contam. Toxicol., 56 (2009), pp. 408–415 http://dx.doi.org/10.1007/s00244-008-9202-x