Analytical laboratories in the pharmaceutical industry may serve many masters: manufacturing operations needs to release product quickly; quality assurance protects patients; product development requires analyses to support understanding of product stability, delivery systems and other factors.
A contract analytical laboratory that works with many pharmaceutical companies, McCrone Associates (Westmont, Ill.) has used Raman microspectroscopy to solve problems for many departments within client organizations. This paper describes applications, advantages and disadvantages of Raman microspectroscopy by way of comparison to infrared (IR) microspectroscopy.
Industrial laboratories use a variety of instruments to assay and characterize raw materials and products, including gas and liquid chromatographs, infrared spectrometers, mass spectrometers, scanning electron microscopes (SEMs) in addition to wet chemistry capabilities.
The still-growing field of Raman microspectroscopy has many pharmaceutical industry applications and can be an important adjunct to other analytical instrumentation. Raman spectroscopy is sometimes erroneously thought of as a “grown-up” version of IR spectroscopy, but it differs from infrared spectroscopy in several ways and the two techniques complement each other.
How does Raman spectroscopy differ from IR spectroscopy?
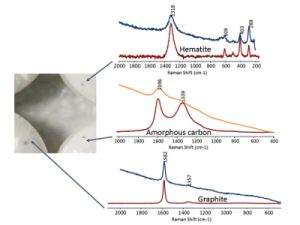
Figure 1 – Raman spectra of dark spots on tablets. Each spot produced a different spectrum corresponding to different contaminants.
Though both Raman and infrared spectroscopy are types of vibrational spectroscopy that provide information about molecular structure, they are not interchangeable. Infrared spectroscopy is an absorption technique based on a change in the permanent dipole of a molecular group and is sensitive primarily to polar functional groups. Raman spectroscopy is a scattering technique based on a change in the polarizability of a molecular group and is sensitive primarily to nonpolar functional groups. Raman and infrared spectrometers are often coupled to a microscope for the analysis of small samples, and data is acquired through a microscope objective (usually 50× in the author’s laboratory). In Raman spectroscopy, it is typical to use an excitation laser in the visible or near-infrared region, while IR spectroscopy employs a broad-spectrum IR source. Instrumentation and physics differentiate the two methods.
How does Raman microspectroscopy apply to the needs of the pharmaceutical laboratory?
Identification of contaminants
Contaminant properties are assessed in the author’s laboratory by light microscopy and then by the most appropriate analysis method, either IR spectroscopy, Raman spectroscopy or SEM.
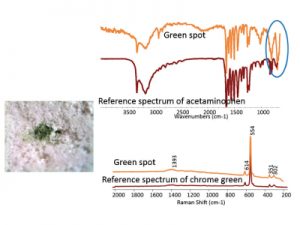
Figure 2 – Infrared spectrum (top) of green contaminant and comparison to a reference spectrum of acetaminophen; bands at long wavelength suggest an inorganic component. Raman spectrum (bottom) of green contaminant and comparison to a reference spectrum of chrome green oxide pigment.
IR is more widely used for the identification of unknowns, such as particulate contaminants or discolored areas on tablets. Identification is possible because IR spectra are often specific and numerous commercial libraries are available. The drawbacks for IR microspectroscopy identification manifest when:
- Sample preparation is necessary
- Particulates are very small
- Particulates need to be recovered for other analyses
- Sample is opaque so that transmission IR cannot be performed
- Contaminant is smaller than about 20 μm (the diffraction limit for mid-IR measurements)
- Materials do not yield IR spectra.
Raman spectroscopy is less commonly employed for the identification of unknowns, but may be useful for particulates or spots under about 20 μm. It is the method of choice for materials such as graphite; many pigments and minerals; and heavily thermally degraded organic material such as charcoal, which cannot be readily identified using IR.
Spots on tablets, a frequent concern, may be the result of metal flakes, embedded hairs or fibers, or of other particulates or discolorations. Spectra from brown spots on three tablets (Figure 1) were obtained after the spot material was isolated onto a reflective surface so that the material would be flat under a 50× objective. They were identified as hematite (Fe2O3), graphite and charred organic material. For these tablets, Raman spectroscopy was the best approach due to the small size and the nature of the particles.
Figure 2 illustrates the relative sensitivities of IR and Raman spectroscopy to a green pigment contaminant on an acetaminophen tablet. The IR spectrum of the spot shows bands from the acetaminophen plus broad absorption at a longer wavelength, which signals inorganic material. The Raman spectrum reveals crisp bands due to the green pigment but no bands due to acetaminophen, even though acetaminophen is a crystalline material that is a good Raman scatterer. In this case, the higher sensitivity of Raman toward the pigment obscured the acetaminophen matrix and allowed the colorant to be identified.
Polymorphism
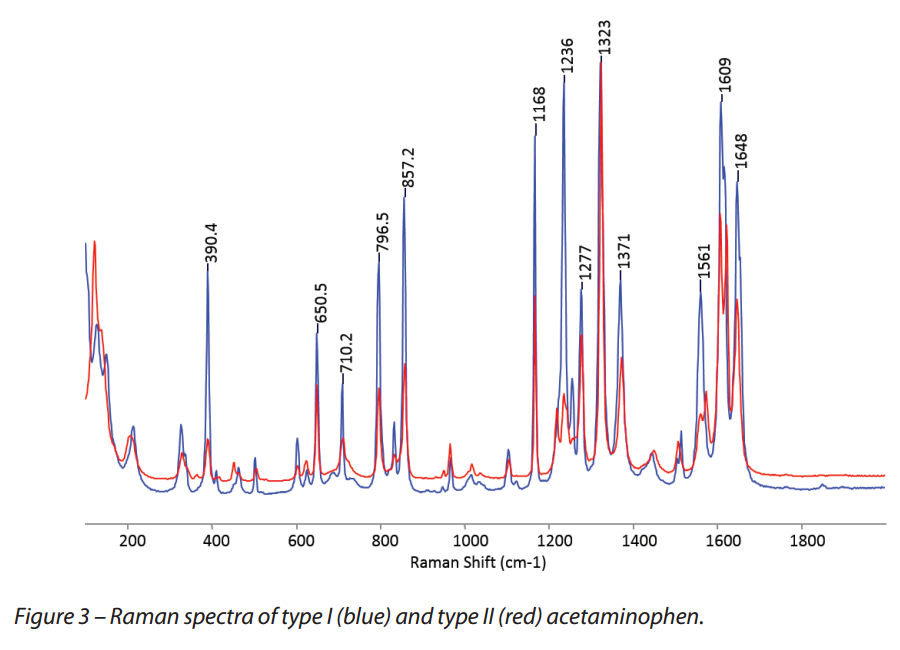
The ability to monitor polymorphs, including hydrates, 1 is one of the most important applications for Raman spectroscopy in the pharmaceutical laboratory. Crystalline materials result in narrow Raman spectral bands, and so even small shifts can signal changes in a material. Infrared spectroscopy is also used to monitor polymorphism, but the spectra may have broader bands, and differences between polymorphs can be more difficult to detect.
An example of a material that exhibits polymorphism is acetaminophen, which can be present as type I (monoclinic), as found in over-the-counter preparations, or type II (orthorhombic), a form that arises when the drug is heated and then slowly cooled. Type I and type II acetaminophen have different relative intensities and band shifts (Figure 3).
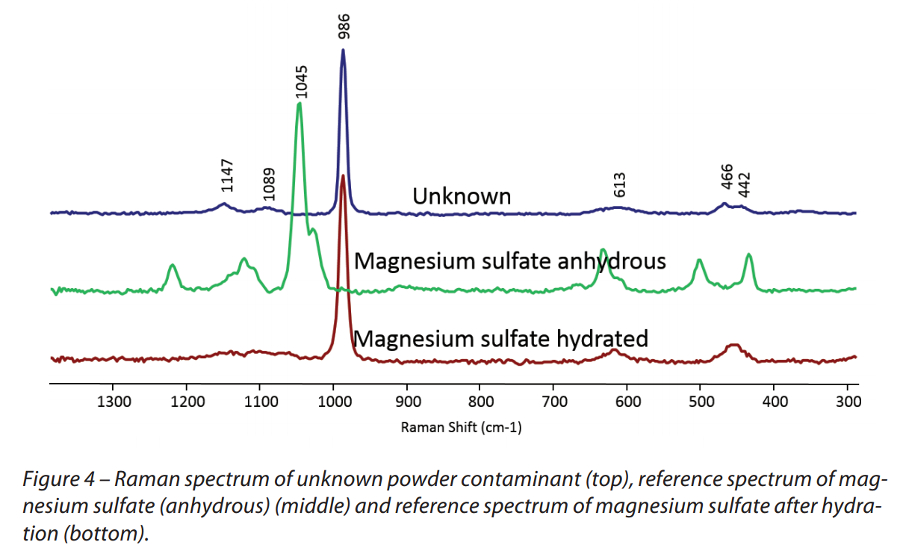
Another example that demonstrates the limitations of Raman spectroscopy as an identification tool is magnesium sulfate, which was initially encountered in the author’s laboratory as an unknown contaminant—its Raman spectrum was suggestive of an inorganic sulfate, but did not match the library spectrum. Elemental analysis from SEM/EDS (energy-dispersive spectroscopy) indicated Mg, O and S. The Raman and EDS data were reconciled when a reference sample of MgSO4 was hydrated and the subsequent Raman spectrum, which was considerably different from its spectrum in the initial dried state, matched the unknown (Figure 4).
Advantages of Raman microspectroscopy for particulate analysis
- Small spot size: Typical Raman microscopes can analyze particles or inclusions on the order of 1 µm in size using a 50× microscope objective and a visible excitation laser. In contrast, the lower limit for typical commercial IR microscopes is around 20 µm.
- Use of a polarized light microscope: Raman microspectrometers use a polarized light microscope as a focusing element, but the microscope can provide additional value by allowing the operator to select particles with unique morphologies or optical characteristics.
- Sample preparation/presentation: While often not needed, a limited amount of sample preparation can be useful with Raman spectroscopy samples to make them flat enough to achieve good focus through the microscope. Furthermore, in some cases, isolation from a matrix may be beneficial in reducing fluorescence effects. Particles can be presented on a reflective substrate such as aluminum, on a KBr or NaCl crystal, or on glass (although glass may contribute fluorescence effects). In contrast, samples for IR microscopy in transmission mode must be made thin in order to be transparent to IR radiation and placed on an IR-transparent substrate such as KBr or NaCl.
Glass is a poor Raman scatterer; thus spectra can be acquired through glass containers, as long as they are not too thick. This allows environmentally sensitive or hazardous materials to remain protected while being analyzed. Glass is a strong IR absorber and glass containers or substrates should be avoided with infrared spectroscopy. - Wavelength region: Commercial Raman systems typically provide data down to 100–200 cm-1, unlike mid-IR systems, which yield data down to about 700–600 cm-1. The longer wavelength region provided by Raman spectroscopy is especially useful for many inorganic and crystalline compounds.
- Selectivity of components in a mixture: Raman spectroscopy may have very different sensitivities toward different components in a mixture, as was seen for the green spot on the acetaminophen tablet. For example, a low concentration of a crystalline active pharmaceutical ingredient (API) in a noncrystalline matrix may be easily identified because it may have a strong Raman spectrum. Infrared spectroscopy, on the other hand, is sensitive to crystalline and noncrystalline components. IR spectroscopy offers bands for all major components, and thus is a better choice for their surveillance.
Drawbacks of Raman microspectroscopy
- Small spot size: The small spot size typically employed in Raman microspectroscopy may not allow for true representation unless multiple areas are analyzed. A lower-magnification objective can be used to sample a larger area, but at the cost of reduced signal intensity.
- Use of a polarized light microscope: A 50× microscope objective can make it difficult to achieve good focus, as the depth of field is very shallow. Out-of-focus samples, unless they are strong Raman scatterers, do not produce high-quality spectra. A lower magnification objective may permit greater depth of field, but at the cost of reduced Raman signal intensity.
- Selectivity of components in a mixture: The variable sensitivity of Raman spectroscopy to different components in a mixture can lead to confusion. Raman spectroscopy may not detect certain highly concentrated components in the presence of a strong Raman scatterer and should not be used to survey major ingredients.
- Lack of commercial libraries: While commercial IR libraries are abundant, there are few commercial Raman libraries. The author’s laboratory relies primarily on libraries compiled in-house. Spectral interpretation and evaluation of spectral matches are critical steps in the identification process. In some cases, the correct match is not in a library and the top hits may be unrelated to the material in question. In addition, shifts in Raman bands due to hydration, crystallinity or other factors may make it impossible for search software to recognize the “correct” answer.
- Fluorescence: The most significant challenge to routine use of Raman spectroscopy is fluorescence. It is much more efficient than Raman, and broad strong fluorescence bands can mask weak Raman bands. Fluorescence is often minimized by changing to a different wavelength excitation laser, although it may persist for some samples.
- Sample heating: Lasers can deliver a high amount of power (a few mW or more) through a 50× microscope objective and can burn material or cause other changes. Carbon nanotubes, for example, are notorious for subtle changes due to heating effects, so when working with them laser power needs to be maintained at a low level.2Some compounds can be converted to another form with exposure to laser heat, such as black ferrous oxide, which converts to red/brown ferric oxide. Samples like pigmented hairs can scorch under the laser beam, as can samples like a sprig of rosemary.
Conclusion
Raman microspectroscopy can provide insight into ingredient distribution via chemical mapping or imaging.3 It can also be used for quantitative analysis4 and structure determination and in the detection of counterfeit drugs. Specialized techniques are being developed, such as tip-enhanced Raman scattering (TERS) and surface-enhanced Raman scattering (SERS), which may enhance the sensitivity of Raman spectroscopy.
For the identification of particulate contaminants, Raman spectroscopy offers the ability to identify some types of materials that cannot be readily identified by IR spectroscopy. The small spot size allows identification of contaminants down to about 1 µm. Raman spectroscopy can also be a valuable tool in the evaluation of polymorphisms.
References
- Larkin, P.J.; Dabros, M. et al. Polymorph characterization of active pharmaceutical ingredients (APIs) using low-frequency Raman spectroscopy. Appl. Spectrosc. 2014, 68(7), 758–76.
- Judek, J.; Jastrzebski, C. et al. Laser induced temperature effects in multi-walled carbon nanotubes probed by Raman spectroscopy. Phys. Status Solid. A 2012, 209(2), 313–16.
- Sasic, S. and Clark, D.A. Defining a strategy for chemical imaging of industrial pharmaceutical samples on Raman line-mapping and global illumination instruments. Appl. Spectrosc. 2006, 60(5), 494–502.
- Strachan, C.J.; Rades, T. et al. Raman spectroscopy for quantitative analysis of pharmaceutical solids. J. Pharm. Pharmacol. 2007, 59(2), 179–92.
